While the United States is ranked 37th in the world in education spending, the 14 richest Americans earned enough money from their investments in 2015 to hire two million preschool teachers.
Yes, inequality is getting worse every year. In early 2016, Oxfam reported that just 62 individuals held the same wealth as the bottom half of humanity. About a year later Oxfam reported that just 8 men had the same wealth as the world’s bottom half. Now, based on the same methodology and data sources used by Oxfam, that number is down to 6.
How do we account for the dramatic increase in the most flagrant and perverse of extreme inequalities? There are two well-documented reasons: (1) The poorest half (and more) of the world has continued to lose wealth; and (2) The very richest individuals — especially the top thousand or so — continue to add billions of dollars to their massive fortunes.
Inequality deniers and apologists say the Oxfam methodology is flawed, but they’re missing the big picture. Whether it’s 6 individuals or 62 or 1,000 doesn’t really matter. The data from the Credit Suisse Global Wealth Databook (GWD) and the Forbes Billionaire List provide the best available tools to make it clear that inequality is extreme and pathological and getting worse every year.
[pro_ad_display_adzone id=”110028″]
How has it gone from 62 to 6 in just one year?
As of February 17th, 2017, the world’s 6 richest individuals (all men) had $412 billion. Tables 2-4 and 3-4 of the 2016 GWD reveal that the poorest five deciles (half) of the world population own just 0.16% of the $256 trillion in global wealth, or $410 billion. That latter figure is based on mid-2016 data, but since then the status of the bottom 50% has not improved, and has in fact likely worsened, as both global debt and global inequality have increased.
Just a year ago, on January 3rd, 2016, the world’s 6 richest men had $343 billion. They’re the same men today, although slightly rearranged as they play “king of the hill”: Bill Gates, Warren Buffett, Jeff Bezos, Amancio Ortega, Mark Zuckerberg, and Carlos Slim Helu (with Larry Ellison jockeying for position). The wealth of these six men increased by $69 billion in just one year.
Just a year ago, according to the 2015 GWD, the poorest five deciles of the world population owned much more than today, close to $1.5 trillion. What happened? It’s very clear: the world’s richest 10% (mostly the richest 1%) gained nearly $4 trillion while every other segment of the global population lost wealth.
That’s worth a second look. The world’s total wealth is about $256 trillion, and in just one year the richest 10% drained nearly $4 trillion away from the rest of civilization.
It’s not just the bottom half: a 500-seat auditorium could hold as much wealth as 70% of the world’s population.
According to the Forbes Billionaire List, the world’s richest 500 individuals have $4.73 trillion in wealth. Tables 2-4 and 3-4 of the GWD reveal that the poorest seven deciles of the world population (70%) own just 1.86% of the $256 trillion in global wealth, or $4.76 trillion. That’s over two-thirds of all the people on earth. That means 5,000,000,000 people — five billion people — have, on average, and after debt is figured in, about a thousand dollars each in home and property and savings.
In the U.S., the Forbes 400 own as much as 3/5 of the American people.
The bottom 60% of Americans, according to Table 6-5 in the GWD, own 3 percent of the nation’s $85 trillion in total wealth, or $2.55 trillion. The Forbes 400 owned $2.4 trillion in October 2016, and that’s been steadily increasing.
So, as apologists like the National Review refer to “a growing upper-middle class” of people earning over $100,000 a year, they’re inadvertently offering an explanation for the demise of the middle class: Some are moving up, way up; many others are dropping to the lower-middle-class or below. The once sizable and stable middle of America is splitting into two.
The deniers are lurking.
The Boston Globe’s Jeff Jacoby calls the Oxfam analysis “irrelevant.” Reuters contributor Felix Salmon calls it a “silly stat.”
Jacoby’s column includes some stunning assertions. He says, “Just as capitalism made it possible for Gates, Zuckerberg, and the others to reach the highest rung on the economic ladder, it is making it possible for billions of men and women to climb up from the lowest rung. Oxfam’s billionaires are richer than they used to be. So is almost everyone else.” And he quotes writer Johan Norberg: “Poverty as we know it is disappearing from our planet.”
Billions moving up? Almost everyone getting richer? Poverty disappearing?
While we keep hearing about the world “climbing out of poverty,” much of the alleged improvement is due to rapid economic growth in China and creative math on the part of the United Nations. Global debt recently reached a record $217 trillion, or 325% of worldwide GDP. And yes, many Americans have negative wealth because of debt. A human being doesn’t have to live in a third-world slum to be impoverished.
Yet as inequality ravages the American and world economies, denial grows right along with it. Cato’s Michael Tanner suggests that “even if inequality were growing as fast as critics claim, it would not necessarily be a problem.” Conservative political commentator George Will, of course, agrees. But like the other deniers, they all protest too much as they try to explain away reality.
And it seems, the social security safety net is next on their hit list.
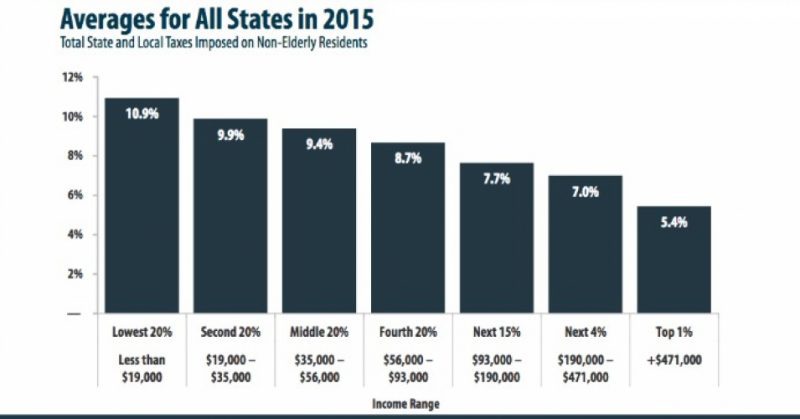
Poor Americans pay the highest taxes and get little of the safety net.
Before taxes on the rich are cut and social programs decimated, uninformed conservatives should consider who really benefits from U.S. tax laws and assistance programs. When ALL forms of taxes and income are considered, poor Americans pay higher tax rates than the richest 1%, who pay very little tax on their full income.

The American tax system, in which those with the least pay the most. Figure represents 50 state (and District of Columbia) average for total state and local taxes paid as a share of 2012 income, post- federal offset. (Source: Institute on Taxation & Economic Policy)
This analysis starts with state and local taxes, which are often ignored by apologists for big-income tax cuts. According to The Institute on Taxation and Economic Policy, the state and local tax rate for the poorest 20 percent of individuals is double that of the top 1 percent (10.9 percent vs. 5.4 percent). New data from Thomas Piketty, Emmanuel Saez, and Gabriel Zucman allows us to go further: When unrealized capital gains are included in the wealth-building of the richest 1%, the overall tax rates plunge for the super-rich, causing the poorest Americans to pay the highest rates.
What is the justification for adding unrealized capital gains to one’s income? The 16th Amendment gives Congress the power “to lay and collect taxes on incomes, from whatever source derived.” Thus, under an original definition of income developed by the American economists Robert M. Haig and Henry C. Simons in the 1920s and still utilized by financial economists, an increase in the value of a stock or other asset would be subject to taxation even if it’s not sold.
With this more accurate guide to income measurement, the real tax rates paid by the 1% can be calculated. Details can be found here. The bottom line is that poor Americans pay about 25 percent in total taxes, while the 1% pays anywhere from 18 to 23 percent.
Rich Americans benefit as much as the poor from the safety net.
Piketty and Saez and Zucman calculate government transfers to three groups: the richest 10%, the middle 40%, and the poorest 50%. Each group is evaluated for total transfers, including Social Security, as a percent of average national income.
Surprisingly, the middle 40% receives more government assistance than the bottom 50%, with a benefit equivalent to 23 percent of national income (see Figure S.13).
More surprisingly, the richest 10% as a group receives almost as much government assistance as the poorest 50%.
The critics of poor Americans should be informed that even after transfers, income for the working-age bottom 50% has not improved since 1979. And they should be reminded that the cost of the entire Safety Net is only about one-sixth of the $2.2 trillion in tax breaks and tax avoidance that primarily benefit the rich.
The super-rich don’t pay much for all their benefits from society.
Most of society’s benefits go to the super-rich and their businesses:
- Financial Assistance: The stock markets, the legal system, patent and copyright systems, intellectual property, contract law.
- The Military: National defense, local police forces, the National Guard, the Coast Guard.
- Infrastructure: In the physical form of highways, railroads, airports; the energy grid; and in the form of communications though the airwaves, especially the Internet.
-
Federal Agencies: The Federal Reserve, SEC, FTC, SBA, FAA, NASA. Research at the Department of Defense, the Air Force, NASA, and public universities.
National wealth does not belong to the 1%.
Today the taking of our national wealth can be tax-deferred indefinitely. A just society should have some form of wealth tax, as recommended by Piketty, perhaps as a modified version of the Haig-Simons call for taxing annual stock gains. Then millions of non-stockholders would rightfully get a piece of our 70 years of national prosperity.
Recommended reading by Paul Buchheit:
- Overwhelming Evidence that a ‘Guaranteed Basic Income’ Will Work
- The Real Terrorists: The 0.01%
- 5 Signs of a Dying Society
- Why Do So Many Americans Defend the Failed Capitalist Experiment?
- Five Great American Hypocrisies
- Capitalism at Its Worst: 5 Deadly Sins of Big Pharma
- 6 Ways Capitalism Kills… and May Be About to Get Deadlier
About the author:
 Paul Buchheit is a college teacher, an active member of US Uncut Chicago, founder and developer of social justice and educational websites (including www.youdeservefacts.org), and the editor and main author of “American Wars: Illusions and Realities” (Clarity Press). His latest book is, Disposable Americans: Extreme Capitalism and the Case for a Guaranteed Income. Paul can be reached via email here.
This work first appeared on www.commondreams.org and is licensed under a Creative Commons Attribution-Share Alike 3.0 License.
[pro_ad_display_adzone id=”110027″]


